

#22404 closed defect (fixed)
[PATCH] MVT background layer: Polygons not drawn
| Reported by: | schwarting | Owned by: | taylor.smock |
|---|---|---|---|
| Priority: | normal | Milestone: | 22.10 |
| Component: | Core imagery | Version: | latest |
| Keywords: | template_report mvt polygon winding | Cc: |
Description
What steps will reproduce the problem?
- In the background image settings, add a new Mapbox Vector Tiles (MVT) layer.
- Use this as URL:
https://hfs.github.io/brandenburg-addresses/style.json - Max zoom: 14, enter a name, e.g. “Brandenburg Addresses”
- Back in the map view, add the new layer from the background imagery menu
- Navigate the map to Brandenburg/Germany: View › Jump to Position › Enter a place name to search for: Brandenburg, Zoom (in metres): 40000
What is the expected result?
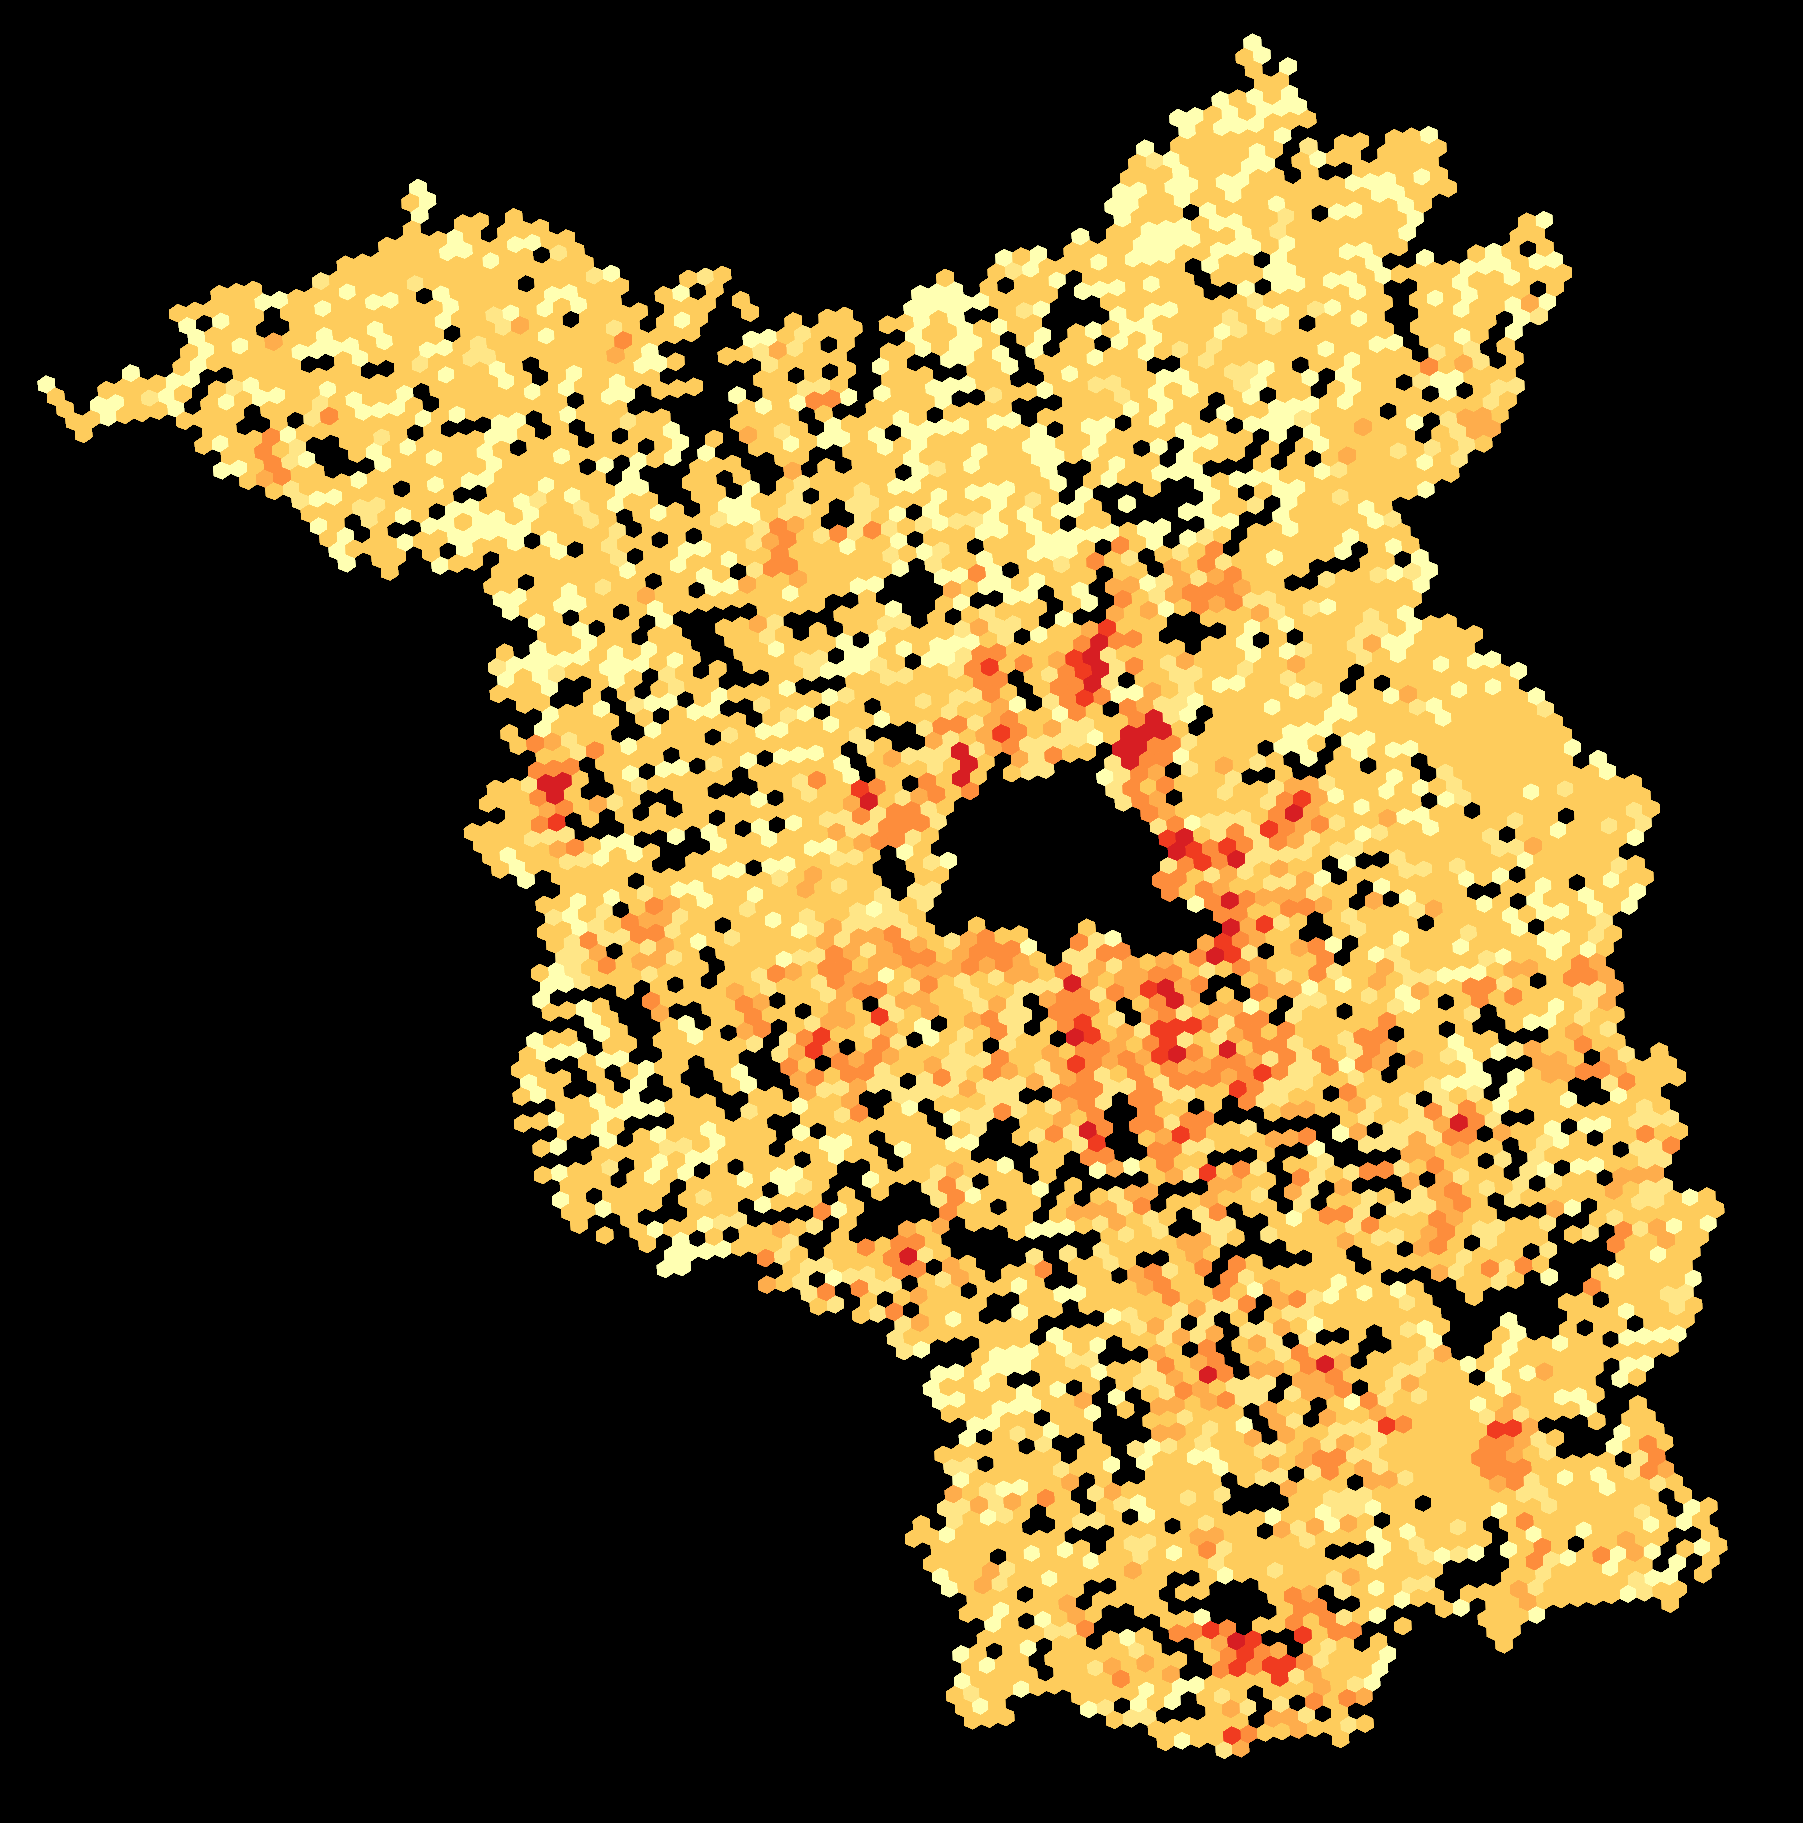
The MVT tiles contain polygons (hexagons in a regular grid) that should be painted as filled areas.
Here’s an interactive editor of the map style. It shows the expected result what the rendering should look like. It also shows that the MVT data is fine, and allows you to inspect the map data:
What happens instead?
No polygons are drawn. The background remains black.
If you zoom in, you can see that the MVTs and the style work in principle. From zoom level 13 and higher it switches to a point visualization which works.
My theory of what goes wrong
I think the issue is the polygon winding order. Polygons are converted twice and at some point the correct winding order gets lost.
In the MVT standard it is prescribed that exterior rings of polygons are oriented in clockwise order (in screen coordinates, y points down). See section 4.3.4.4. “Polygon Geometry Type” in https://github.com/mapbox/vector-tile-spec/tree/master/2.1#4344-polygon-geometry-type.
I tried to debug this a bit and I think this is what happens:
In org.openstreetmap.josm.data.imagery.vectortile.mapbox.Geometry.initializeWayGeometry() the geometry commands of the MVT are interpreted and a polygon is constructed as java.awt.geom.Area. At this point the winding order is still correct.
In org.openstreetmap.josm.data.vector.VectorDataStore.addFeatureData(), shapeToPrimaryFeatureObject() and then areaToRelation() are called to convert the Area into a multipolygon VectorRelation. Area.getPathIterator() iterates over the line segments of the polygon. pathIteratorToObjects() converts the polygon rings into VectorWays. Finally, back in areaToRelation()
Geometry.isClockwise(((VectorWay) member).getNodes()) ? "outer" : "inner"`
is used to set the role of the polygon rings in the multipolygon relation.
During my debugging session, the role was always inner. I assume that is the reason why nothing gets drawn on screen: All polygons are converted to multipolygons which consist of only one hole without exterior ring.
To me it looks like Area is mixing up the order of line segments, so that getPathIterator() doesn’t return them in the same order they were put in.
In my opinion solutions could be to either use a different class than Area to construct the polygons. Or to carry the information whether a ring is exterior or interior as extra attribute and not rely on the winding order.
CCing @taylor.smock, because he wrote the MVT layer implementation.
Background information
The state of Brandenburg in Germany has published georeferenced housenumber address points as Open Data. I would like to provide a QA layer which highlights addresses which are in the “official” data, but might be missing in OSM.
This is the code to generate the MVT tiles: https://github.com/hfs/brandenburg-addresses (Sorry it’s not yet documented, it’s still work in progress at the time of writing).
As mentioned above, this is the style URL: https://hfs.github.io/brandenburg-addresses/style.json
The tiles can be found here: https://hfs.github.io/brandenburg-addresses/tiles/{z}/{x}/{y}.mvt
If you want to inspect single tile files, they can also be browsed here: https://github.com/hfs/brandenburg-addresses/tree/gh_pages/tiles
I’m confident that the winding order in the tiles is correct. They are generated using ST_AsMVT and ST_AsMVTGeom in PostGIS and I would hope that already handles the winding order. I even wrote a tool in https://github.com/hfs/brandenburg-addresses/tree/main/tools to verify that all polygons in all tiles are oriented correctly.
Please provide any additional information below. Attach a screenshot if possible.
Revision:18559
Is-Local-Build:true
Build-Date:2022-09-24 23:00:25

Identification: JOSM/1.5 (18559 SVN de) Linux Debian GNU/Linux bookworm/sid
Memory Usage: 593 MB / 3898 MB (336 MB allocated, but free)
Java version: 14.0.2+12-Debian-2, Debian, OpenJDK 64-Bit Server VM
Look and Feel: javax.swing.plaf.metal.MetalLookAndFeel
Screen: :0.0 3840×2400 (scaling 2.00×2.00)
Maximum Screen Size: 3840×2400
Best cursor sizes: 16×16→16×16, 32×32→32×32
Environment variable LANG: de_DE.utf8
System property file.encoding: UTF-8
System property sun.jnu.encoding: UTF-8
Locale info: de_DE
Numbers with default locale: 1234567890 -> 1234567890
Desktop environment: GNOME
Java ATK Wrapper package: libatk-wrapper-java:all-0.40.0-2
libcommons-compress-java: libcommons-compress-java:all-1.21-1
libcommons-logging-java: libcommons-logging-java:all-1.2-3
fonts-noto: fonts-noto:all-20201225-1
VM arguments: [-agentlib:jdwp=transport=dt_socket,address=127.0.0.1:44149,suspend=y,server=n, -javaagent:/opt/idea-IC-221.5591.52/plugins/java/lib/rt/debugger-agent.jar, -Dfile.encoding=UTF-8]

Plugins:
+ DirectDownload (36011)
+ DirectUpload (35951)
+ FastDraw (35978)
+ ImportImagePlugin (36013)
+ Mapillary (2.0.0-beta.17)
+ OpeningHoursEditor (35924)
+ PicLayer (1.0.2)
+ PolygonCutOut (v0.7)
+ apache-commons (36003)
+ apache-http (35924)
+ buildings_tools (36011)
+ editgpx (35931)
+ ejml (35924)
+ geotools (36015)
+ gson (35924)
+ jackson (36006)
+ javafx (35807)
+ jaxb (35952)
+ jna (36005)
+ jts (36004)
+ log4j (36007)
+ measurement (35978)
+ opendata (36011)
+ pt_assistant (1ff2e15)
+ public_transport (36011)
+ reverter (36011)
+ scripting (v0.2.7)
+ terracer (35978)
+ utilsplugin2 (36011)
+ wikipedia (605)

Tagging presets:
+ /usr/share/josm/data/defaultpresets.xml
+ https://raw.githubusercontent.com/osmlab/name-suggestion-index/main/dist/presets/nsi-josm-presets.min.xml

Map paint styles:
- https://josm.openstreetmap.de/josmfile?page=Styles/ParkingLanes&style&zip=1
- https://josm.openstreetmap.de/josmfile?page=Styles/Maxspeed&style&zip=1
- https://josm.openstreetmap.de/josmfile?page=Styles/Modified&style&zip=1
- http://github.com/bastik/mapcss-tools/raw/osm/mapnik2mapcss/osm-results/mapnik.zip
- https://josm.openstreetmap.de/josmfile?page=Styles/ParkingLanes&style&zip=1
- https://josm.openstreetmap.de/josmfile?page=Styles/Cycleways&style&zip=1
- https://josm.openstreetmap.de/josmfile?page=Styles/Lane_and_Road_Attributes&zip=1
- https://josm.openstreetmap.de/josmfile?page=Styles/PublicTransport&zip=1
- https://josm.openstreetmap.de/josmfile?page=Styles/Building_Levels_Labels&zip=1
- https://josm.openstreetmap.de/josmfile?page=Styles/Coloured_Streets&zip=1

Last errors/warnings:
- 00002.953 E: JavaFX is not available
- 00003.012 W: Erweiterung deaktivieren - JavaFX ist nicht verfügbar. Bitte installieren Sie OpenJFX über den Paketmanager.
- 00007.933 E: Id 'openpt_map' is not unique - used by 'OpenPT Map (overlay)' and 'OpenPT Map (overlay)'!
- 00013.901 W: Cannot lock cache directory. Will not use disk cache
- 00017.585 E: Fehler beim Laden des Bildes 'bus.png'
- 00018.764 W: Cannot start IPv4 remotecontrol server on port 8111: Die Adresse wird bereits verwendet
- 00018.764 W: Cannot start IPv6 remotecontrol server on port 8111: Die Adresse wird bereits verwendet
- 00022.999 W: java.net.SocketTimeoutException: Connect timed out
- 00023.111 E: Fehler beim Laden des Bildes 'http://openptmap.de/favicon_pt.png'
Attachments (6)
Change History (20)
by , 2 years ago
| Attachment: | Bildschirmfoto vom 2022-09-26 21-39-45.png added |
|---|
by , 2 years ago
| Attachment: | 01_mvt_parsing.png added |
|---|
During parsing of the MVT tile, the polygon nodes are in clockwise order. The coordinates are relative to the starting point.
by , 2 years ago
| Attachment: | 02_polygon_construction.png added |
|---|
When constructing the polygon, the coordinates are turned into absolute tile coordinates. One can see that the winding order is still clockwise correctly.
by , 2 years ago
| Attachment: | 03_area_order_of_curves.png added |
|---|
When requesting the line segments from the Area though, they are not returned in the same order, so they are not guaranteed to be clockwise.
comment:1 by , 2 years ago
Thanks for the analysis. When I was writing the code, I was testing against Mapillary and OpenInfraMap tiles. OpenInfraMap didn't have an easy style for me to test against, so I don't think I ever really tested the area code (my main interest was keeping Mapillary working at the time, and having vector code for other sites was a nice bonus).
I'll double check after I finish going through and fixing higher priority bugs. If I forget, please ping this ticket in two weeks or so.
comment:2 by , 2 years ago
It looks like Area doesn't always keep the same winding order.
The geometry of the path describing the outline of the Area resembles the path from which it was constructed only in that it describes the same enclosed 2-dimensional area, but may use entirely different types and ordering of the path segments to do so.
Anyway, it is a fairly simple fix. Unit testing it might be a bit harder.
I'm going to look into why the style sheet isn't being converted into a roughly equivalent mapcss style sheet.
EDIT: The style sheet was fine. The render code was expecting only WAY and I was giving it CLOSEDWAY.
comment:3 by , 2 years ago
| Cc: | removed |
|---|---|
| Milestone: | → 22.10 |
| Owner: | changed from to |
| Status: | new → assigned |
| Summary: | MVT background layer: Polygons not drawn → [PATCH] MVT background layer: Polygons not drawn |
I found a minor bug in the rendering code as well. I've got a fix for that.
by , 2 years ago
| Attachment: | 22404.patch added |
|---|
Correct way direction when Area messes it up, fix rendering issue with VectorWay (getType now unconditionally returns WAY, and now implements getDisplayType), improve documentation for implementors of getType.
comment:4 by , 2 years ago
Thanks a lot for the quick fix! I can confirm that the patch fixes the issue for me.
(Now I can optimize the style so it fits the zoom levels better and needs less resources.)
comment:5 by , 2 years ago
Before you do that, check and make certain JOSM is showing what is expected at the zoom level you are optimizing for.
I think we might be loading z14 tiles at z15 or something like that.
comment:6 by , 2 years ago
I think that might have to do with Selector.fromLevel(int, int):
457                 if (b != Integer.MAX_VALUE) {
458                     lower = level2scale(b + 1);
459                 }
460                 if (a != 0) {
461                     upper = level2scale(a);
462                 }
Usually in Mapbox GL JS styles when you configure a zoom level, it goes from minzoom inclusive to maxzoom exclusive. E.g. if one rule goes from minzoom 12 to maxzoom 14 and another one from 14 to 16, they would go from 12.0 to 13.99 and from 14.0 to 15.99. This way there would be a seamless transition at 14.0.
With this current code, if you want a rule to go from 12 to 13.99 you need to write minzoom 12 to maxzoom 13 in the style, because 1 gets added to the maxzoom.
Maybe in the org.openstreetmap.josm.data.imagery.vectortile.mapbox.style.Layers constructor 1 needs to be subtracted from the maxzoom to counterbalance this?
comment:7 by , 2 years ago
Mmh, I’ve adapted https://hfs.github.io/brandenburg-addresses/style.json to take this into account. The layers now use 0-13, 14-14, 15-15, etc. So it’s supposed to show polygons until z13 and then seamlessly switch to points at z14. But still, when zooming in, there’s a gap at zoom 14 where nothing is displayed. When zooming further to z15, I get the expected points visualization.
I noticed a strange connection to the Tiles zoom offset setting in the Imagery Preferences. I’m on a HiDPI display. When I leave the Tile zoom offset at 0, nothing is displayed at z14. When I switch to -1, though, there is no such gap and z14 displays the expected points.
(If you want to test, I’ve updated the online stype file, so you have to clean the disk cache to see the new version.)
comment:8 by , 2 years ago
If you are right with "minzoom inclusive to maxzoom exclusive", than 0-13, 14-14, 15-15, etc. dosn't make really sense. 14-14 would be mathematically an empty range (translated like "from 14 to 13.99"), but maybe they are interpreted wrong.
Have you tried 0-14, 14-15, 15-16, etc. instead.
by , 2 years ago
| Attachment: | JOSM_two_zoom_levels_rendered_at_the_same_time.png added |
|---|
In JOSM, two layers for zoom levels 16 (circles) and 17 (text labels) are rendered at the same time
comment:9 by , 2 years ago
Hey, of course, that’s what I tried first. I should have given more context in my message. Let me try to expand.
In Mapbox GL
I have added a variant of my style here: https://hfs.github.io/brandenburg-addresses/mapbox-gl-style.json
It uses zoom levels 0–14, 14–15, 15–16, …, 19–20, 20+.
When rendering the style with Mapbox GL, the intervals are interpreted to be inclusive on the minzoom side and exclusive on the maxzoom side. This way, at every fractional zoom level, it is clear which layers are rendered.
You can see it in action here: https://maputnik.github.io/editor/?style=https://hfs.github.io/brandenburg-addresses/mapbox-gl-style.json#7.39/52.454/13.436
Especially check the transition from zoom level 16 to 17 where the visualization switches from circles to text labels.
In JOSM on the other hand, the maxzoom is interpreted to be inclusive. So e.g. at zoom 17.0 the rules for 16–17 and 17–18 are applied. This results in circles and text labels both being rendered: https://josm.openstreetmap.de/attachment/ticket/22404/JOSM_two_zoom_levels_rendered_at_the_same_time.png
How it is in JOSM
JOSM currently needs the zoom levels to be defined as 0–13, 14–14, 15–15, …, 19–19, 20+. This is implemented in https://hfs.github.io/brandenburg-addresses/style.json.
When this style is loaded in JOSM – with the patches of this ticket applied – it results in mostly the desired visualization.
In Mapbox GL however, you would see nothing for zoom levels 13+. As you said, the intervals 14–14, 15–15 are empty, so nothing gets rendered. You can test it here: https://maputnik.github.io/editor/?style=https://hfs.github.io/brandenburg-addresses/style.json#7.39/52.454/13.436
Currently I see one more problem which seems unrelated: I’m on a HiDPI display with GDK_SCALE=2 enabled for 200 % scaling of the UI. It looks like the loaded MVT tiles are off by one zoom level. My tiles have different content per zoom level: 0–13 contains polygons, 14 points with minimal info, and 15 points with full info. Currently nothing is shown for me at zoom 14, and I think that happens because tiles of the wrong zoom level are used.
When I change the Tiles zoom offset setting in the Imagery Preferences to -1, that fixes the symptoms.
How it should be in JOSM
If you ask me, I would find it beneficial if JOSM was compatible to styles made for Mapbox GL rendered maps. I wonder if the solution could be as easy as adding 1 to the maxzoom in org.openstreetmap.josm.data.imagery.vectortile.mapbox.style.Layers where the conversion to MapCSS happens.
Regarding the Tiles zoom offset, I don’t think it may be applied in the same way for MVTs as it is for raster tiles. For raster tiles it is fine, because they show the same content in different resolutions. MVTs can have different logical content per zoom level, though.
Usually tile creators will put more abstract data in lower zoom levels to keep the data density low, and put the fully detailed data only in the highest zoom levels.
Therefore the Tiles zoom offset setting might be used to change the visual zoom factor of MVTs: E.g. if the editor is at zoom 10, load zoom 9 MVTs and use the zoom 9 rules to visualize them, but draw everything twice as large.
For the generic case it won’t work to load MVTs for one zoom level and apply rendering rules of a different zoom level on it.
comment:10 by , 2 years ago
I'll debug this later this week/early next week. If I haven't merged anything by next Wednesday, ping this ticket.
comment:12 by , 2 years ago
@schwarting: I tested with mvt[15]:https://hfs.github.io/brandenburg-addresses/mapbox-gl-style.json , just so you know.
I haven't done any investigation into the HiDPI problem. That should probably be a different bug.
comment:13 by , 2 years ago
Hey @taylor.smock, thanks a lot for your quick help in this ticket and for your JOSM contributions in general! 💐
Expected visualization – This is what the data looks like in Maputnik, and it should be rendered similarly in JOSM